/SI Mean Reversion
08/26/2011 9:03 am Leave a comment

Explain markets. Share trades. Track them.
07/20/2011 4:24 pm Leave a comment
The regression area of 7/11/11 – 7/18/11 correlates to a spike in the VIX.

04/20/2011 5:48 pm Leave a comment
SPY has found resistance of 134 nearly to the penny three times within the last two weeks and once again on 2/16.
I don’t use technical analysis often but the support/resistance levels, the spinning top reversal candle, and large capitulation last Monday are interesting considering how the broad market has timed this move with the kickoff to earnings season. Good levels when thinking about risk/reward.


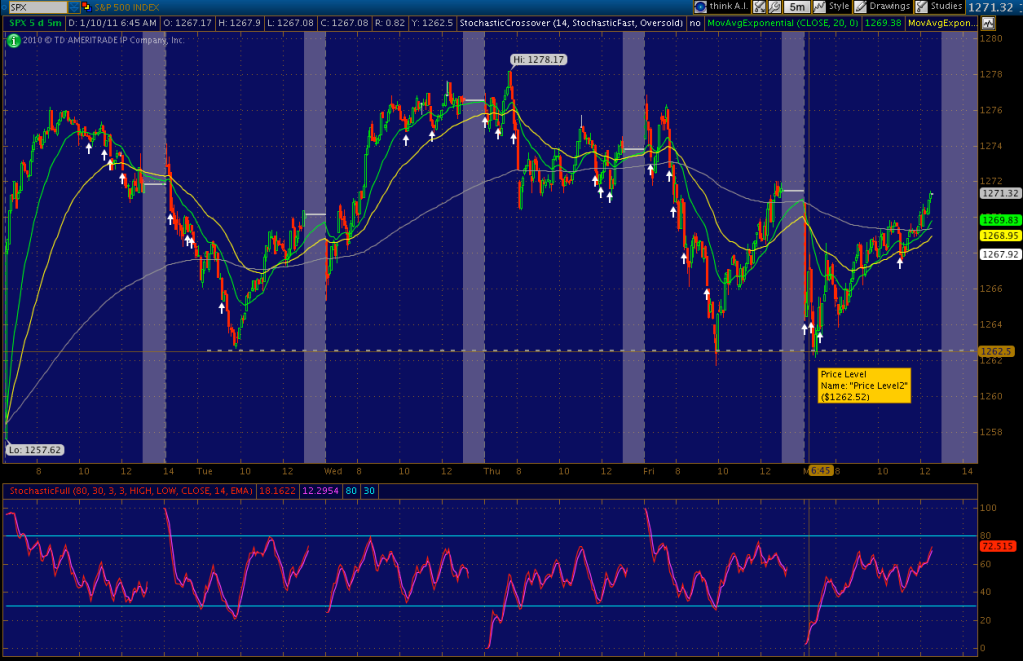
01/10/2011 12:34 pm Leave a comment
There is a clear support level in the S&P 500 at 1262.50. Will watch for a pullback in the index before taking new entries. [click on the chart for a higher resolution image]
01/04/2011 3:32 pm Leave a comment
This is an important pattern to master. When this and accomodating indicators line up, there is a high probability chance of a breakout. If you can find this pattern in the market when the underlying stock is a solid company then you will have a high success rate when your entries are disciplined and you exercise patience.
Here are some examples:
This is an example of a falling wedge pattern. Typically these breakout at the halfway mark of the wedge pattern as indicated by the grey dotted price-level.
Here is another wedge pattern with a breakout from the 200 ema.
The two previous charts show how the wedge pattern plays out. Sprint was an entry I made on Monday and will be in my portfolio until the pattern plays out to completion. Will track Sprint as it breaks out.
12/07/2010 9:29 pm Leave a comment
It is important to have confidence in your entries as predetermined from your risk tolerance.
Here is an example of a setup with multiple entries; as the setup progresses you develop your cost average.

11/23/2010 6:35 pm Leave a comment
Looking forward to a pop in the market tomorrow.

11/23/2010 10:40 am 1 Comment
The TL resistance turned into support on 11/18. Today in the S&P we saw a breakdown below support levels lasting an hour. We entered a few positions during this intraday period of market weakness and anticipate strength through the rest of the day.
Looking for a hedge in the SDS or another good spot to get in the VIX.
")


